Gene ontology analysis of CPuORF transcripts across taxa.
Arabidopsis CPuORFs are enriched upstream of metabolic, developmental and regulatory networks
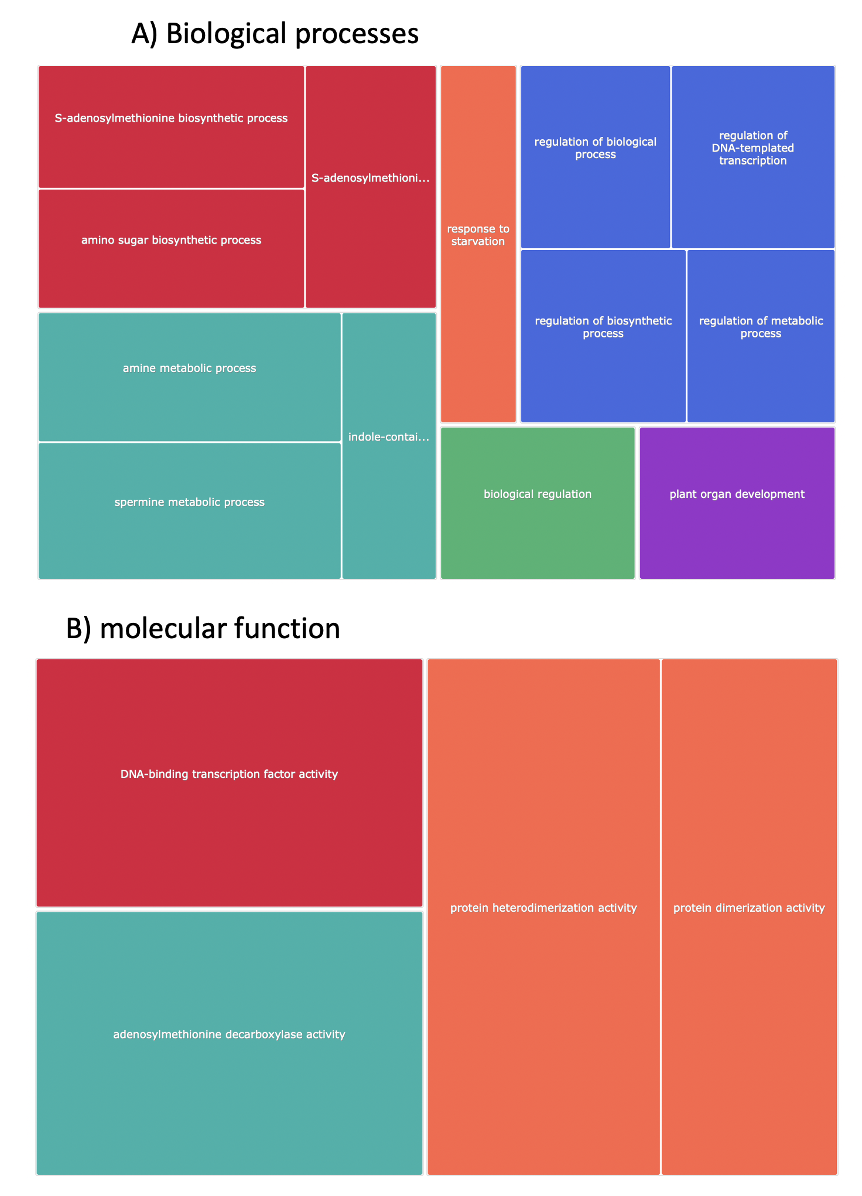
Figure 5. Gene ontology analysis suggests Arabidopsis thaliana CPuORFs are enriched in regulatory genes in metabolic, development and regulatory networks. The GORILLA tool compared CPuORF transcripts against regular uORF containing transcripts. The comparison revealed an enrichment of gene ontology terms regarding gene regulation, signalling and metabolism. Gene ontology analysis results is visualised by a treemap by Revigo to illustrate enriched GO terms in CPuORF containing transcripts. A) Clustering analysis of biological processes presented as a treemap. Terms have been coloured coded to represent clustering groups. (Red = AdoMet biosynthetic processes, teal = amino biosynthetic processes, dark blue = regulatory networks, orange = starvation response, green = regulation and purple = organ development) B) Clustering analysis of molecular functions presented as a treemap. (red = transcription factor activity, orange = protein heterodimerization activity and teal = AdoMet decarboxylase activity).
Drosophila CPuORFs are enriched upstream of RNA regulatory mORF and mORFs that form catalytic complexes and organophosphate biosynthesis
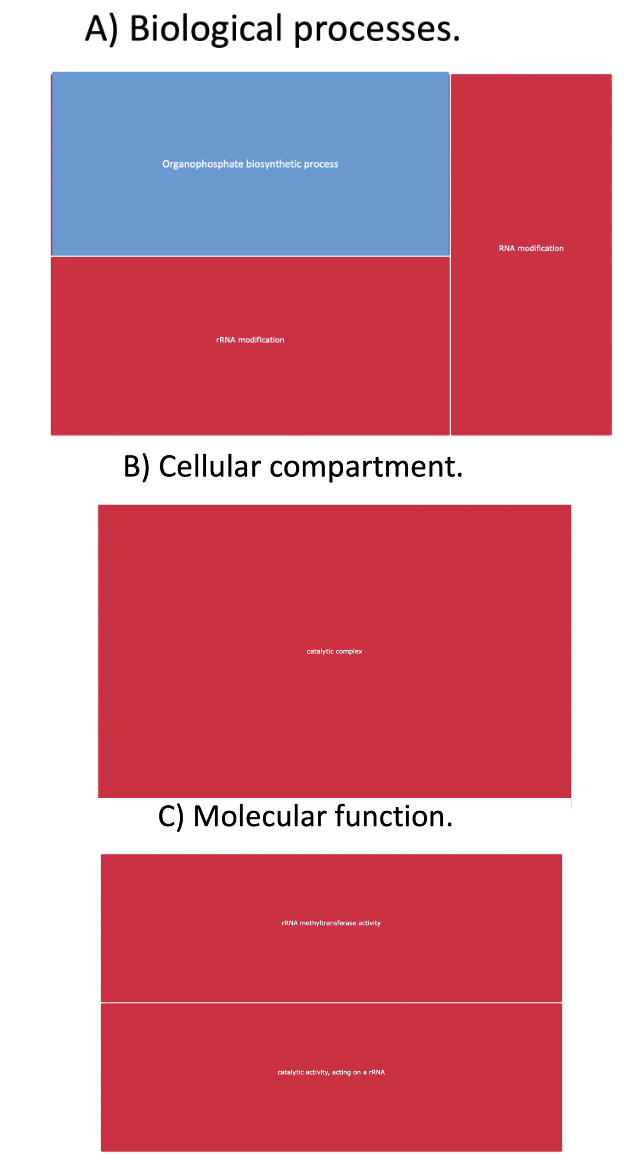
Figure 6. Gene ontology analysis suggests Drosophila melanogaster CPuORFs are enriched in catalytic complexes, RNA and rRNA modification and organophosphate biosynthetic processes. The GORILLA tool compared CPuORF transcripts against regular uORF containing transcripts. The comparison revealed an enrichment of gene ontology terms regarding gene regulation, signalling and metabolism. Gene ontology analysis results is visualised by a treemap by Revigo to illustrate enriched GO terms in CPuORF containing transcripts. A) Clustering analysis of biological processes presented as a treemap. Terms have been coloured coded to represent clustering groups. (Red = rRNA and RNA modification, blue = organophosphate biosynthetic processes). B) Clustering analysis of cellular compartment presented as a treemap. (red = catalytic complexes). C) Clustering analysis of molecular function presented as a treemap (rRNA modification).
Homo sapiens CPuORFs are enriched upstream of regulatory mORFs and mORFs involved in signaling and development
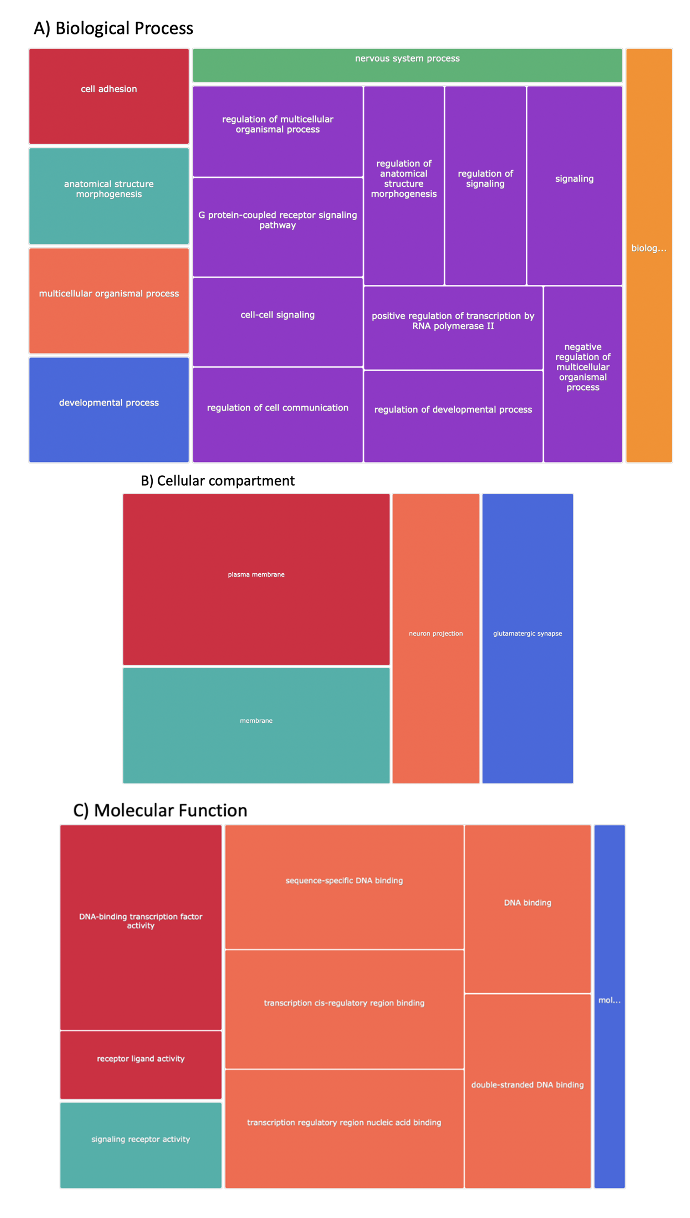
Gene ontology analysis suggests Homo sapiens CPuORFs are enriched in regulatory, signalling, and developmental networks. The GORILLA tool compared CPuORF transcripts against regular uORF containing transcripts. The comparison revealed an enrichment of gene ontology terms regarding gene regulation, signalling and metabolism. Gene ontology analysis results is visualised by a treemap by Revigo to illustrate enriched GO terms in CPuORF containing transcripts. A) Clustering analysis of biological processes presented as a treemap. Terms have been coloured coded to represent clustering groups. (Red = cell adhesion, blue =developmental process. Teal anatomical structure morphogenesis, orange = cellular organismal process, green = nervous system process, purple = signalling and regulation, yellow = biological regulation). B) Clustering analysis of cellular compartment presented as a treemap. (red = plasma membrane, teal = membrane, orange = neuron projection and blue = glutamatergic synapse). C) Clustering analysis of molecular function presented as a treemap (red = transcription factor and receptor activity, teal = signalling receptor activity, orange = transcription factor and DNA binding activity, blue = molecular transducer activity).
CPuORF length differs across taxa when compared to uORFs.
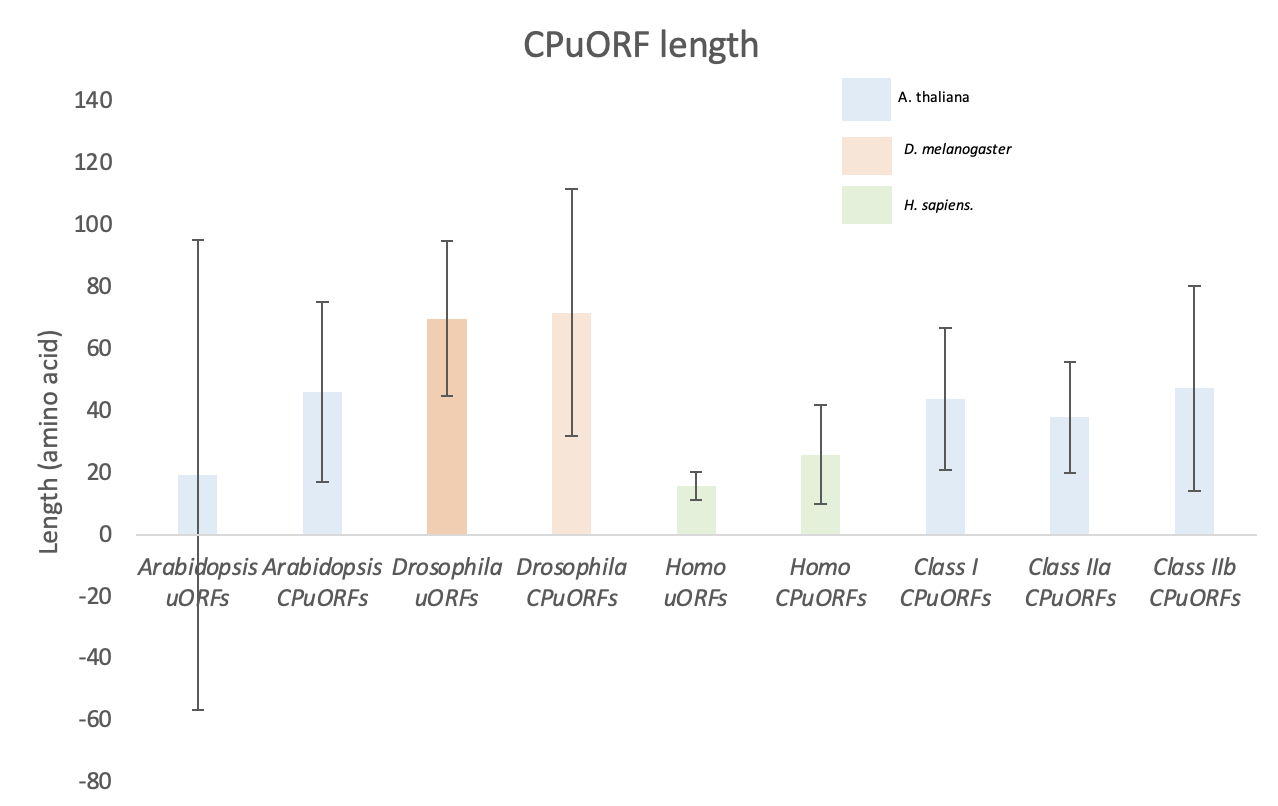
Figure 8. A comparative analysis of uORF and CPuORF lengths across Arabidopsis thaliana, Drosophila melanogaster, and Homo sapiens. Average uORF and CPuORF length (amino acids) are presented as a bar chart. Error bars represent standard deviation. Arabidopsis thaliana and Homo sapiens average CPuORF length is longer than their uORFs. Drosophila melanogaster CPuORFs are a similar length to their uORFs. There is no difference between Arabidopsis CPuORF length across CPuORF class.
CPuORFs are are found in 10x more transcripts in humans than in plants and flies
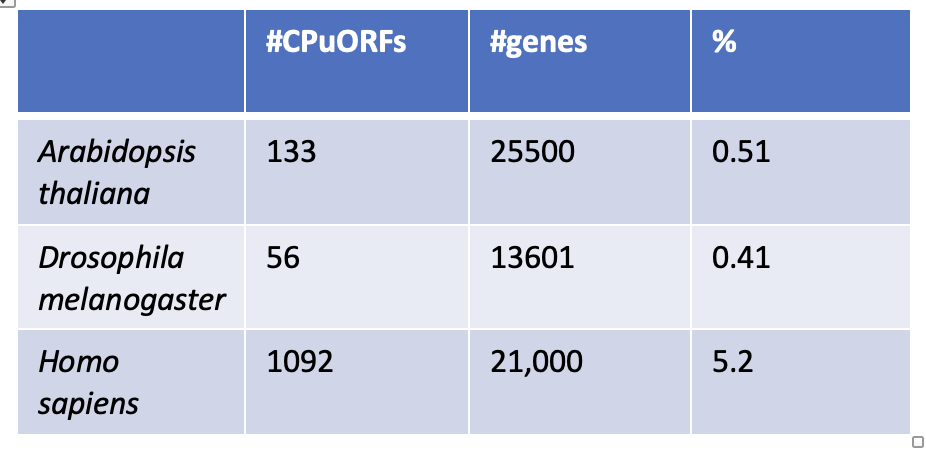
Table 3. A table of CPuORF rarity to show Human CPuORFs are 10x more common than Drosophila and Arabidopsis CPuORFs. Data was collected from the eukaryotic CPuORF database